
Developing Open Data
If blockchain is to be a truly decentralised technology stack, we need to decentralise the data and make it more accessible. In this article I'm going to show how easy it is to analyse blockchain data with 3 common scenarios of key trading times, MEV and arbitrage.

Putting power back into the hands of users
The Internet was intended to be a town square of open data, but Web2 has given us a walled garden of closed data controlled by tech giants. Web3 promised to break down the Web2 walls with open ledgers, but Web3 data is broken. If blockchain is to be a truly decentralised technology stack, we need to decentralise the data and make it more accessible. In this article I'm going to show how easy it is to analyse blockchain data with 3 common scenarios of popular trading times, MEV and arbitrage.
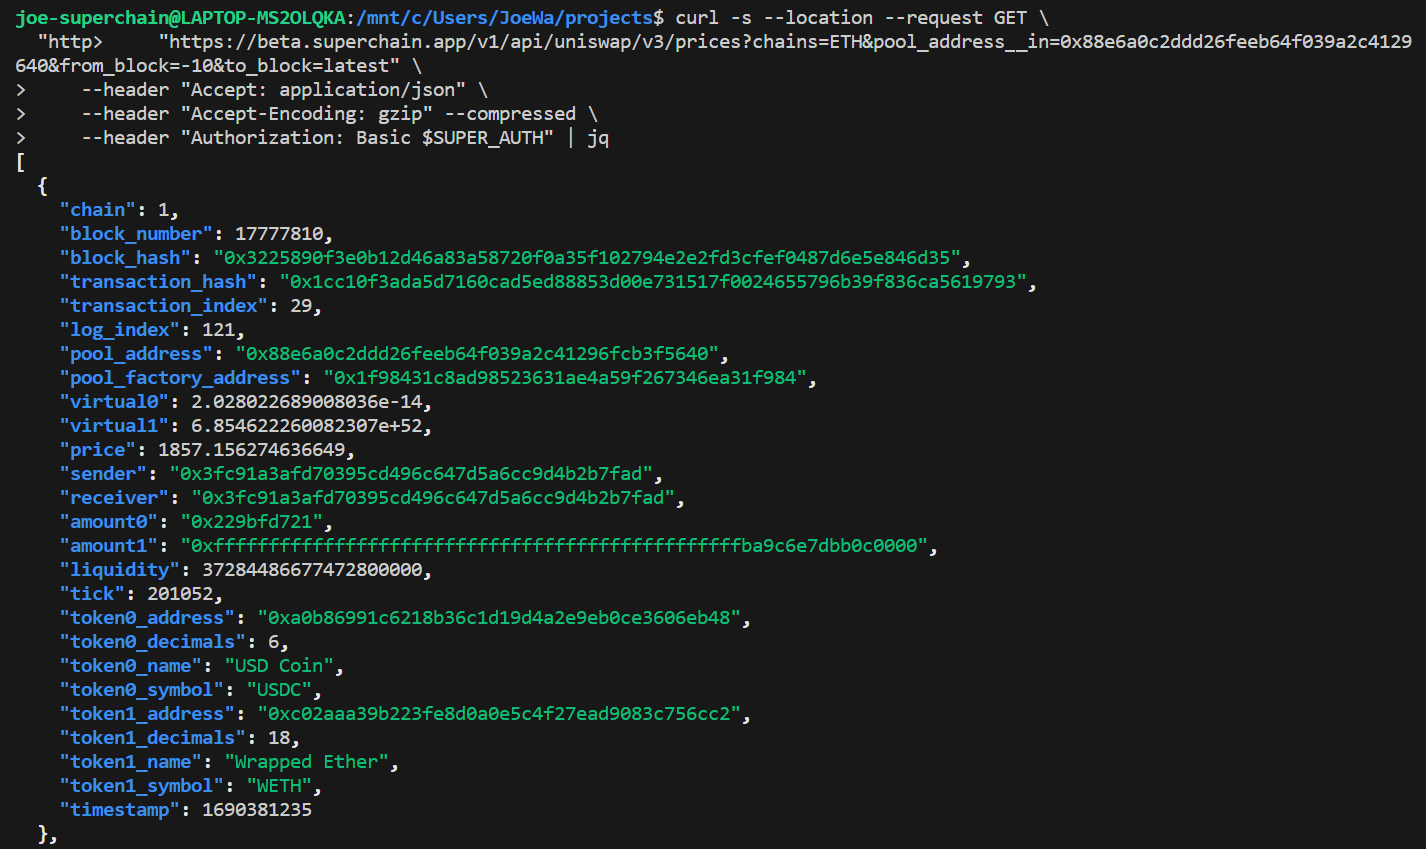
To give an example of the power of having easy access to open data, I took an arbitrary sample of DEX data to see what insights I could find using some basic analysis techniques. Using Superchain API, in seconds I ran a query returning all transactions in the Uniswap V3 WETH-USDC pool for the latest 10,000 blocks. The data was exported in CSV format and using Excel I plotted several charts.
This first chart plots the number of transactions in the pool for hourly intervals, along with the price.
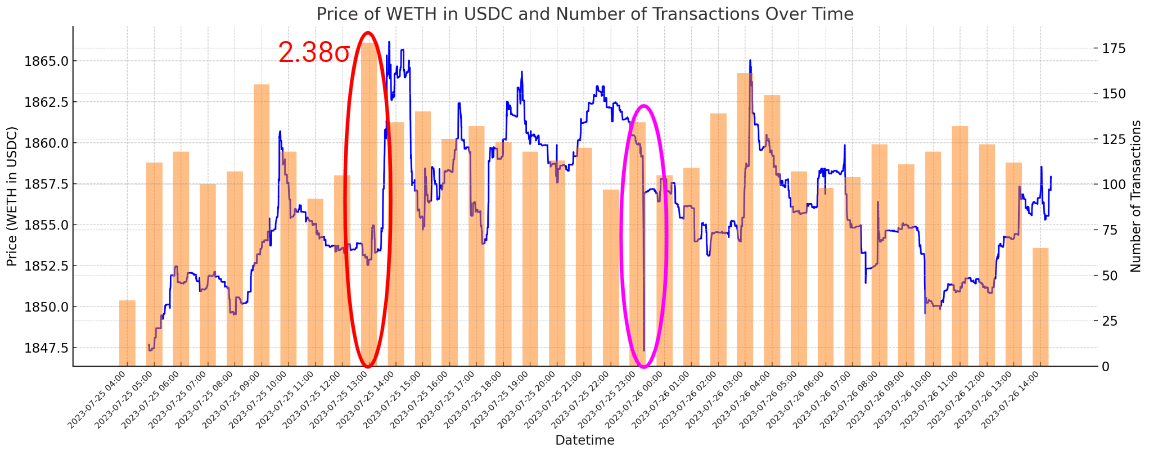
I first checked the data for statistically significant variances. The bar highlighted in red indicates the peak number of transactions. This could indicate a popular trading time (1pm UTC is early afternoon in Europe, late evening in Asia, morning in North America), or a time of low gas cost. A deeper investigation could backtest these hypotheses against a larger historical range and compare other data, such as gas costs, transaction volume and data from other pools.
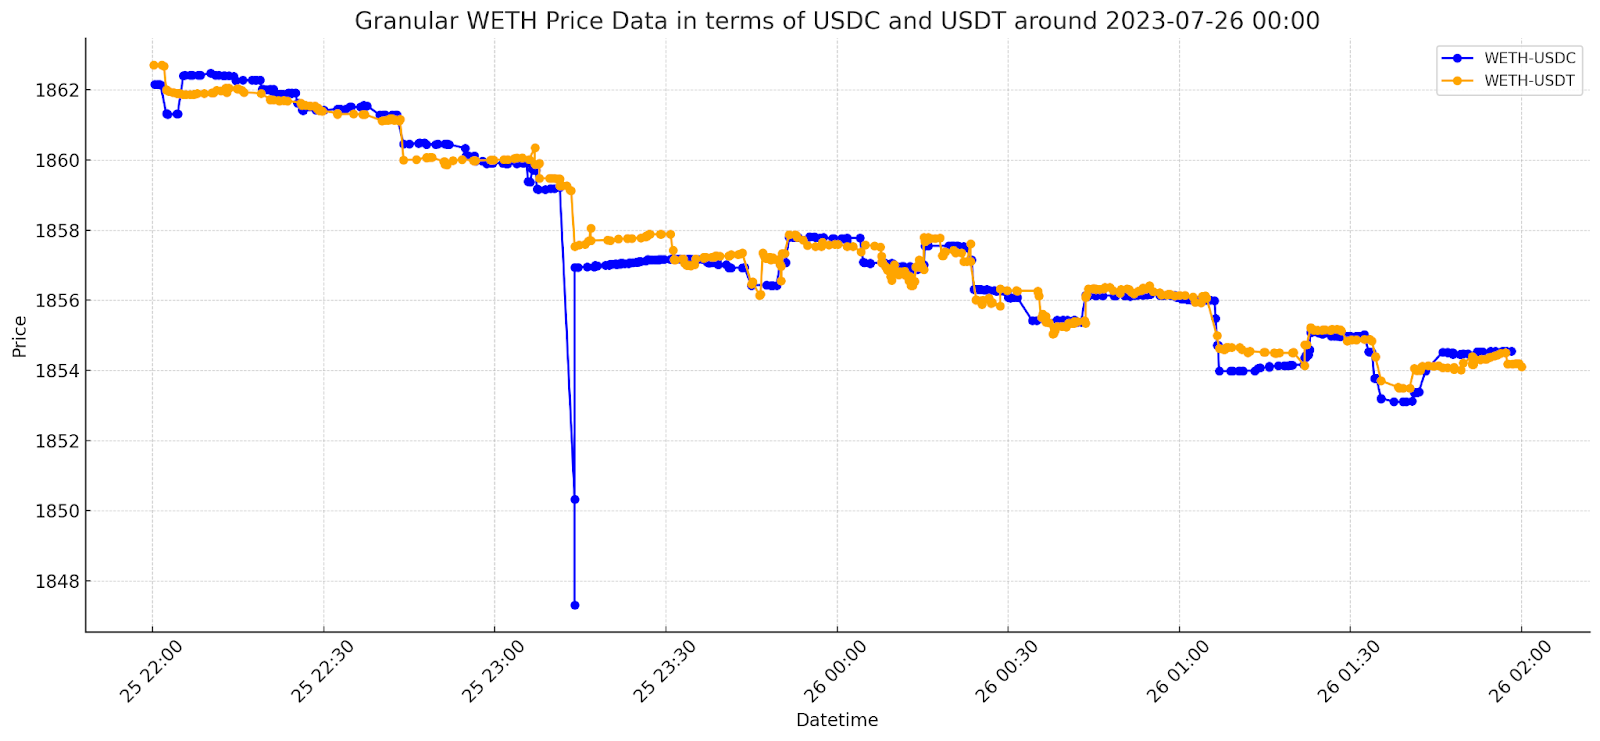
For the price, the area highlighted in pink warranted deeper investigation. This sharp downward spike in price does not appear in CEX data and so reflects an on-chain event which is particular to this pool. To take a closer look, I plotted a more granular view of price for this specific time period.
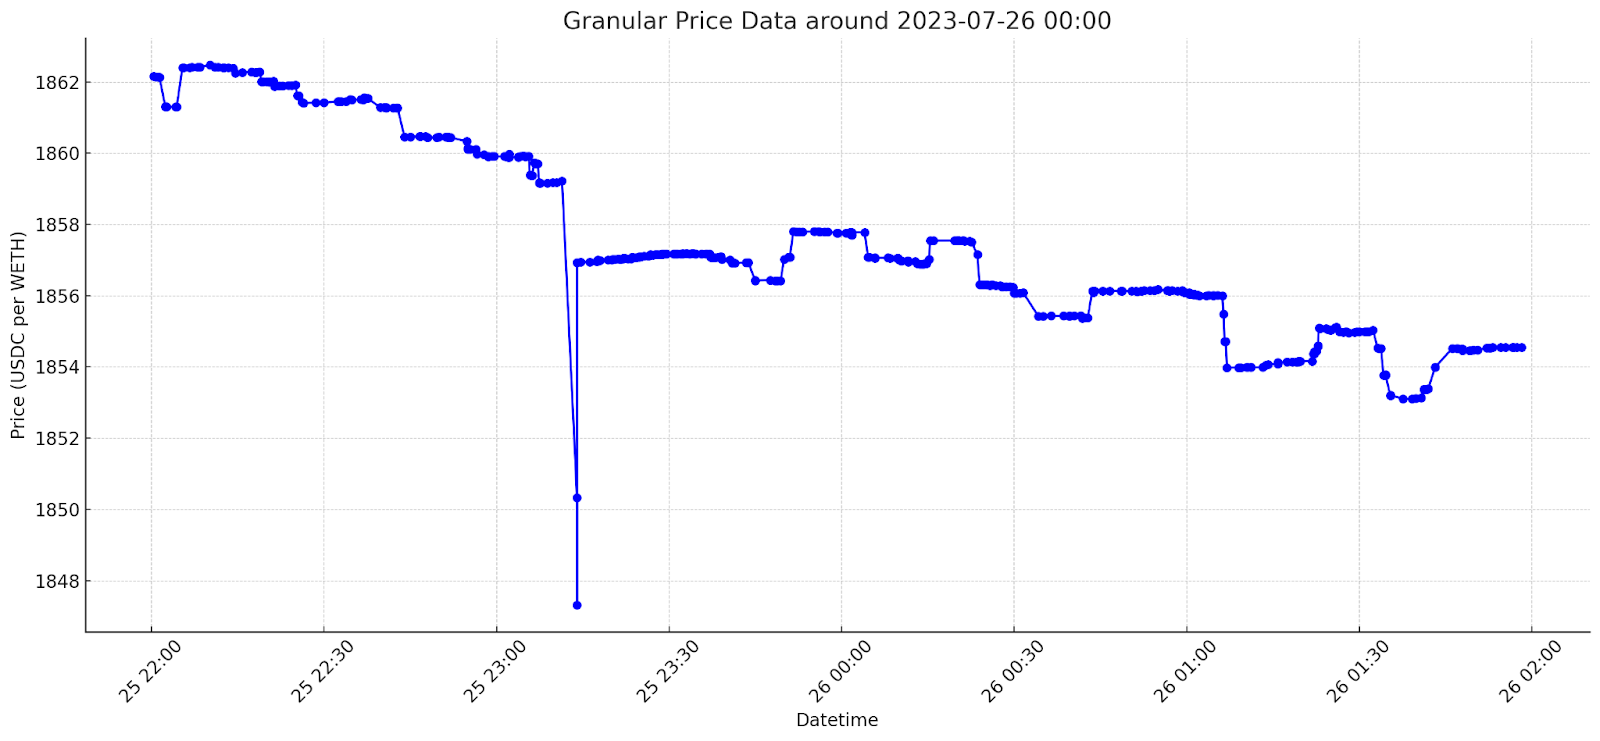
A closer inspection reveals that the spike occurs in the space of three transactions which execute within the same block. Let’s take an even closer look and show block numbers on the x-axis.
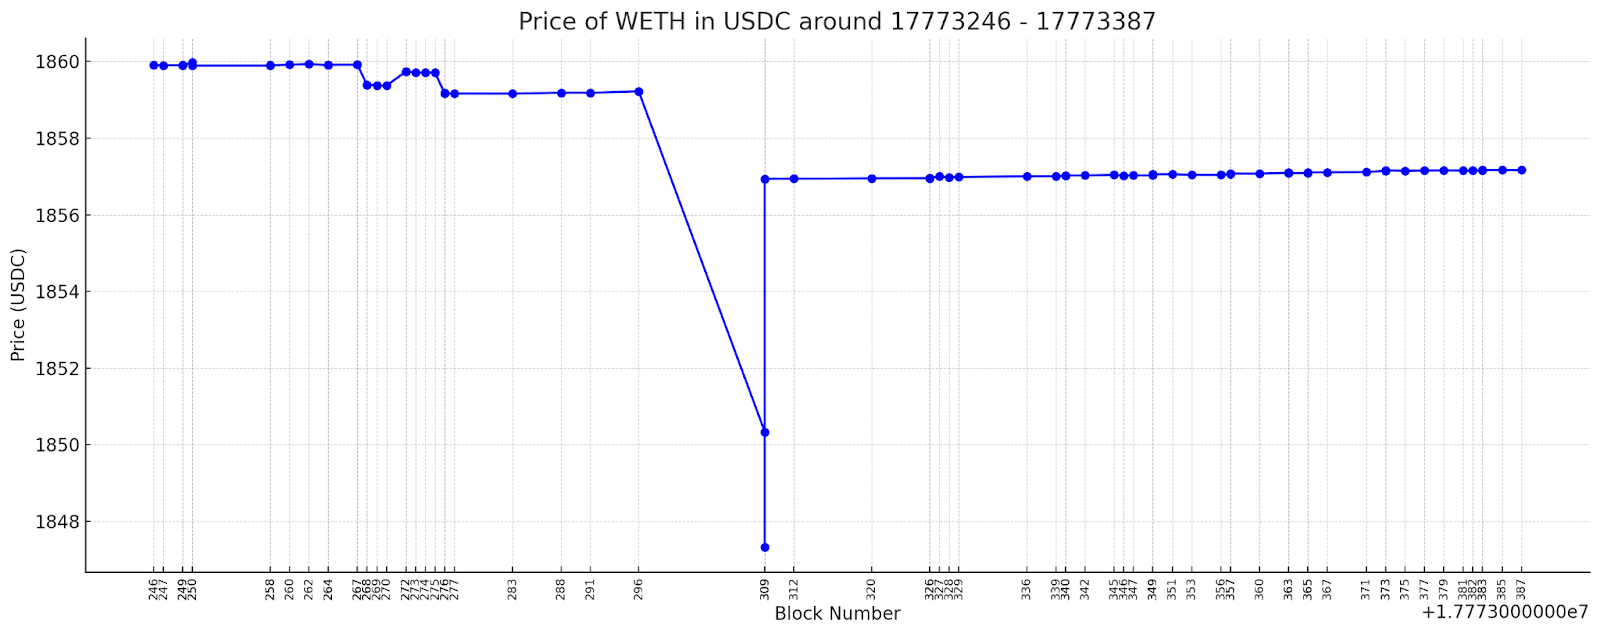
Superchain’s granular transaction-level data allows us to gain insights that wouldn’t be possible using aggregated or block-level data. I can see that at block 296 the price was 1859.22, but in block 309 three transactions execute which take the intra-block price from 1850.33, down to a low of 1847.32, then back up to 1856.93. Transaction analysis reveals a sandwich attack by an MEV bot operator.
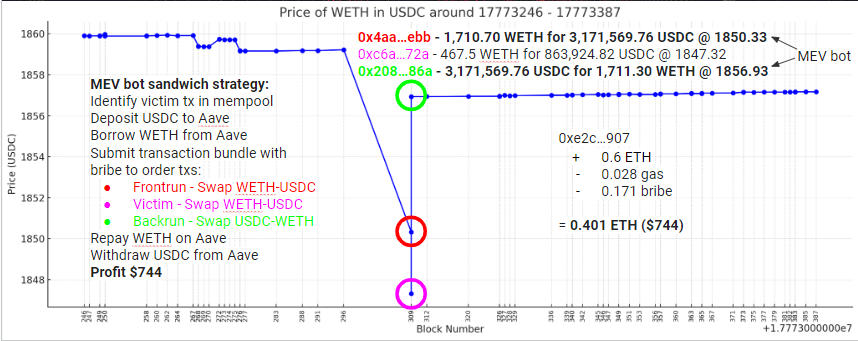
Here’s how the bot’s strategy plays out:
- Identify the victim’s large WETH sell order waiting in the mempool
- Deposit USDC to Aave
- Borrow WETH from Aave
- Submit transaction bundle with a bribe to reorder transactions:
- Frontrun tx
- Victim tx
- Backrun tx
- Repay WETH on Aave
- Withdraw USDC on Aave
All of these events execute programmatically within block 309. The bot receives 0.6 ETH more than they started out with, and after paying 0.028 ETH in gas and 0.171 ETH in bribes they made 0.401 ETH ($744) in profit using over $3.1m in capital. The unfortunate victim received a worse execution price for their WETH sale than they otherwise would have.
I wanted to find out more about the victim, so I looked at the detail of their transaction. This was a multi-call transaction to the Uniswap router, which spread their WETH sale across the WETH-USDC pool and the WETH-USDT pool to achieve better pricing. I ran a query for the same block range on the WETH-USDT pool and overlaid the plot.
At this scale it appears that there was a potential arbitrage opportunity between the pools due to the price difference caused by the MEV bot’s transactions in the WETH-USDC pool. But let’s take a closer look…
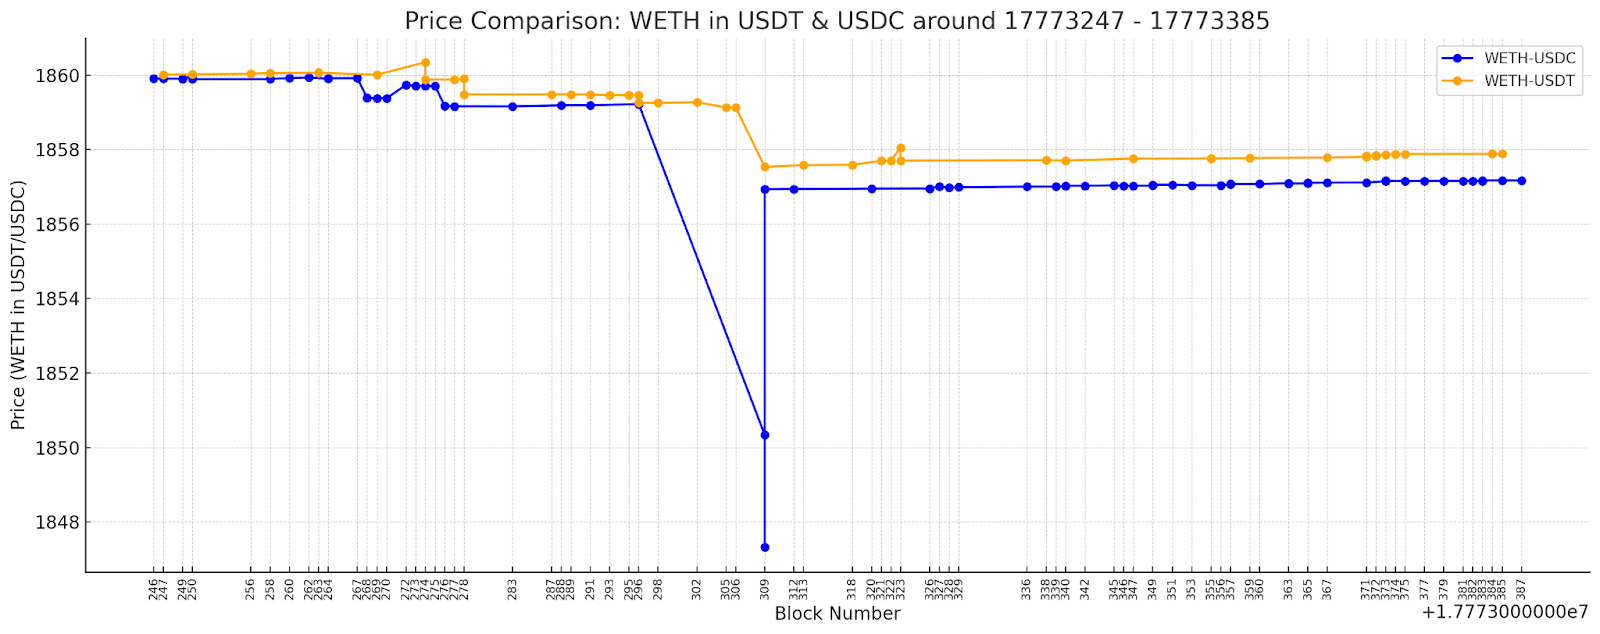
On closer inspection, I can see that although at the low of block 309 there was a $10.08 price difference between the pools, the bot’s backrunning transaction brought the price back in line within the same block. The slight remaining price difference between the pools may not have been profitable to arbitrage given the gas costs of executing, or may reflect a premium which the market is willing to pay for USDT. Thus, with access to Superchain’s granular transaction data it is evident that the apparent arbitrage opportunity may not have been realisable. A deeper analysis might investigate the relationships between gas costs and price differences, how much liquidity exists within this tick range to capture value from these price differences and the premium which USDT trades at relative to USDC.
So what did I learn from 10,000 blocks?
- The peak number of transactions was at 1pm UTC
- A large ETH seller was the victim of a sandwich bot
- There was a significant intra-block price difference between the USDC-WETH and USDT-WETH pools
This was all discovered by me, a degen user of Web3 data, in a couple of hours. Imagine what a data scientist - or better still, a machine learning model - could do!
Making open data accessible is key to unlocking the value of Web3 data. Just as Google transformed the Internet by indexing web pages and providing a user-friendly query interface, Superchain is transforming Web3 by indexing public blockchains and giving users the tools to access the data they need.
Please get in touch.